Share on Social Media:
The Top 5 Iron Ore Producing Countries
| Country | Iron Ore Production 2011 (metric tons) |
Metal content | |
|---|---|---|---|
| 1 | China | 1,33 billion metric tons | 412,0 million metric tons |
| 2 | Australia | 488,0 million metric tons | 277,0 million metric tons |
| 3 | Brazil | 372,5 million metric tons | 248,0 million metric tons |
| 4 | India | 240,0 million metric tons | 154,0 million metric tons |
| 5 | Russia | 100,0 million metric tons | 60,0 million metric tons |
 Special Report
- World crude steel production decreased from 1326.6 million metric tonnes in 2008 to 1219.0 million metric tonnes in 2009, a dramatic fall of -8.1 %. But while most of the world saw falling production, crude steel production in China increased by 13.5 %, compared to the 2.3 % growth the year before. China now accounts for almost half of the world production of crude steel (47 %). In 2010, Chinese steel production drives growth, but there has been some growth in most other large producing countries as well, compared to 2009. If the production rate of the first four months of 2010 continues, the total output of crude steel in 2010 will be somewhere around 1410 million metric tonnes (similar to the record year of 2007). The latest World Steel Association's short term forecast for world steel use anticipates a rise in steel use by 10.7 % in 2010.
- World production of iron ore fell by 6.2% in 2009 to 1.6 billion tons. This was the first fall in production after seven years' consecutive growth period. Output decreased in most countries, with a few notable exceptions such as Australia and South Africa but this was not enough to stop the fall.
- Despite the recession, iron ore trade reached a new record level in 2009 as exports increased for the eighth year in a row and reached 955 Mt, up 7.4 % compared to 2008. The increase was the result of higher demand in China combined with a fall in domestic production.
- The three largest iron ore companies, Vale, Rio Tinto and BHP Billiton increased their control over global iron ore production to 35.4 % in 2009 (34% in 2008). The "Big Three" control 61% of the world seaborne trade of iron ore. New iron ore mining capacity taken into operation in 2009, reached almost 75 million metric tonnes globally.
- According to The "Iron Ore Market 2009-2011" report, the world iron ore market will be characterized by tight conditions and the next few years - by a gradual adaptation of supply, by way of addition of new capacity, to a continuously growing demand. Accordingly, it is believed that that supply will gradually catch up and that prices will decline from the present extreme levels, but will stay at a higher level than in the period before 2008. Major iron-ore-mining companies continue to reinvest profits in mine development, but increases in capacity may outstrip expected consumption within the next few years, as growth dominated by China slows.
- UNCTAD Trust Fund Project on Iron Ore Information. (2010). "The Iron Ore Market 2009-2011 (abstract)". Retrieved November 2010.
- U.S. Geological Survey. (2010). "Mineral Commodity Summaries". Retrieved November 2010.
Tags:
China, The United States, Australia, India, Mining & Minerals
Sources: United States Geological Survey: 2013 Minerals Yearbook. Please visit the source here
List Notes: Data is in U.S. metric tons for the year 2011. Please note: China's gross weight iron ore production figures are significantly higher than that of other countries, because China reports crude ore production only with an average iron content of 33%, whereas other countries report production of usable ore.
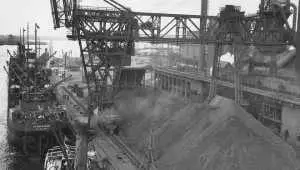
Image by Photographic Collection from Australia (Iron ore, Newcastle) [CC-BY-2.0], via Wikimedia Commons
Sources: United States Geological Survey: 2013 Minerals Yearbook. Please visit the source here
List Notes: Data is in U.S. metric tons for the year 2011. Please note: China's gross weight iron ore production figures are significantly higher than that of other countries, because China reports crude ore production only with an average iron content of 33%, whereas other countries report production of usable ore.
Image by Photographic Collection from Australia (Iron ore, Newcastle) [CC-BY-2.0], via Wikimedia Commons

.jpg)